Summary and Forecast
Geomagnetic Summary and Forecast
Map
Information
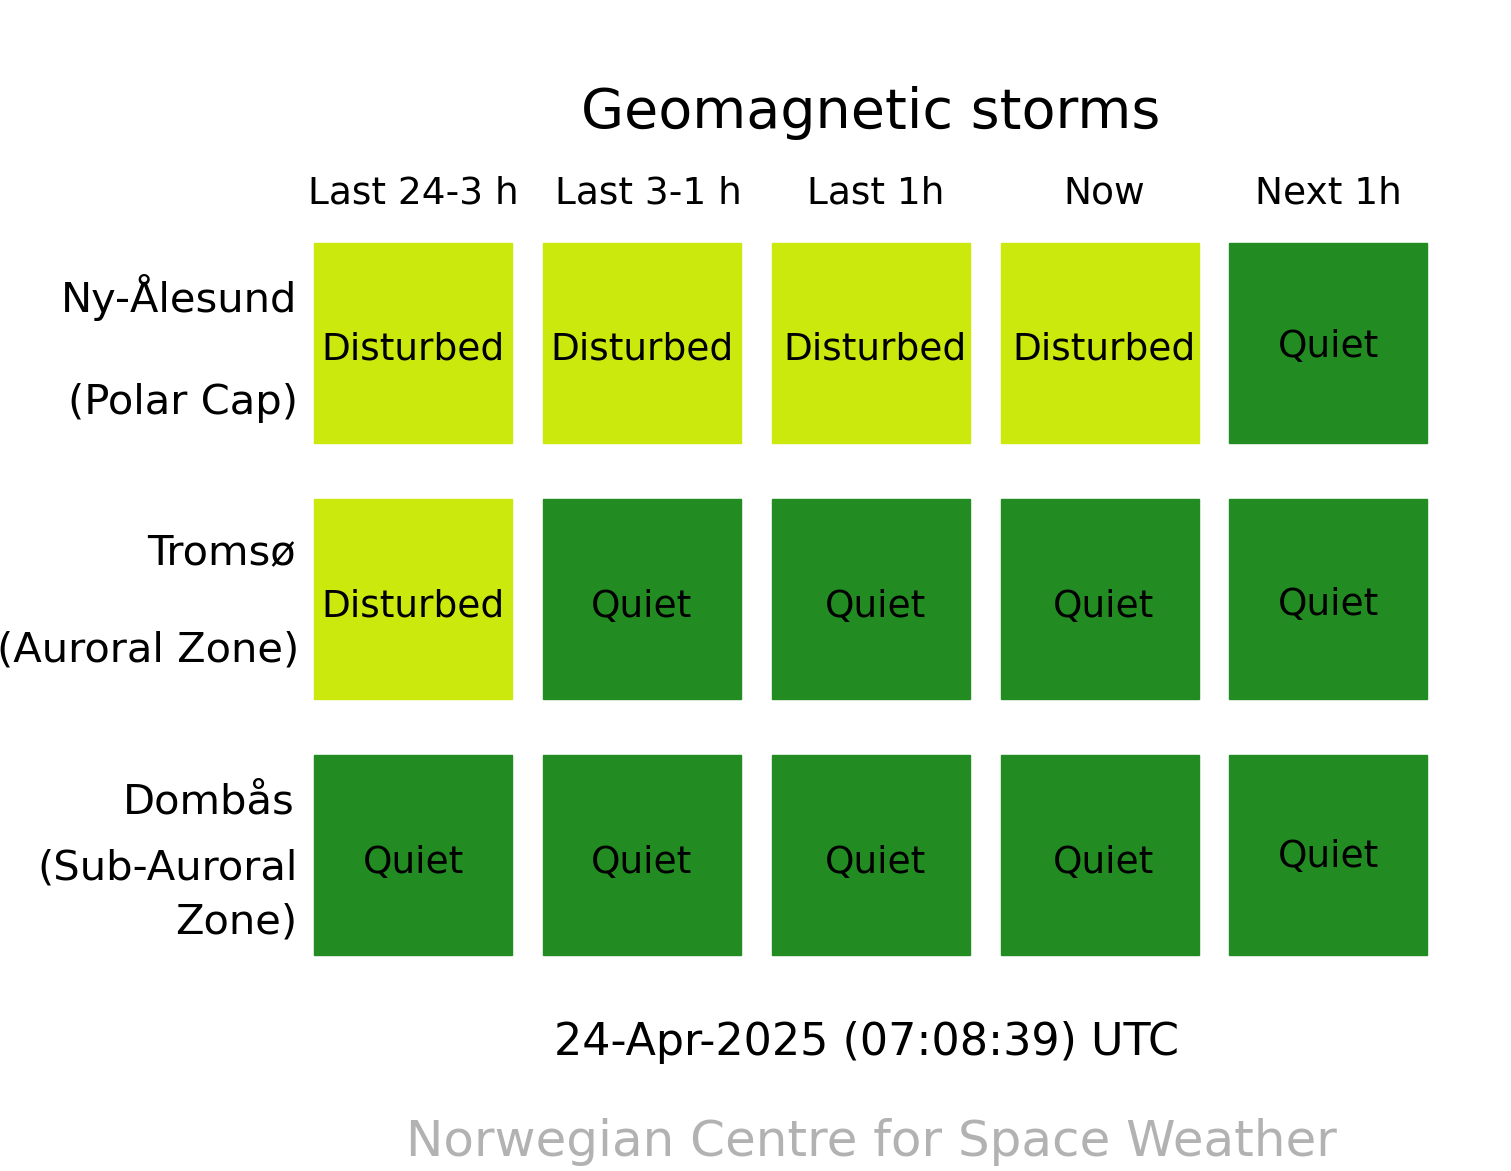
The Local Geomagnetic overview and 1 hour forecast is based on the the method developed by Watermann and Gleisner described in DMI Technical Report 06-18 (Geomagnetic Activity Forecast Service (GAFS) Final Project Report Vol. 1).
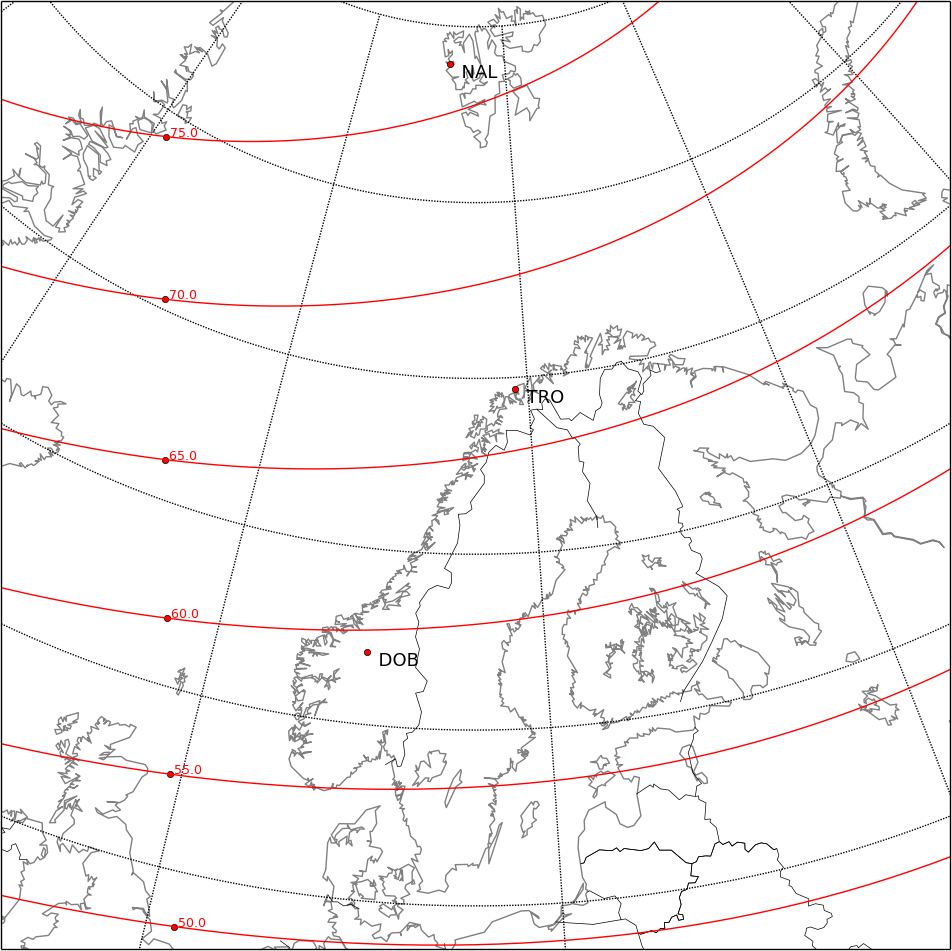
The method uses time shifted solar wind data (IMF and velocity) from DISCOVR satellite at L1 as input. A linear prediction filter with 5 coefficients is applied to, based on the solar wind data, predict geomagnetic variations at a set of selected ground magnetometer stations; Svalbard, Tromsø and Dombås as indicated on the map.
Note: The prediction fails or looses accuracy for disturbances not directly driven by the solar wind, such as substorms.
Disturbance levels are based on the measured deviation in the Horizontal component (dH):
Svalbard and Tromsø
| Colour | Description | Physical Measure | Threshold |
|---|---|---|---|
| Quiet | K<3 | dH < 100 nT | |
| Disturbed | K ⁓ 3-4 | 100 nT ≤ dH < 281 nT | |
| Minor storm | K=5 | 281 nT ≤ dH < 480 nT | |
| Moderate storm | K=6 | 481 nT ≤ dH < 800 nT | |
| Strong storm | K=7 | 801 nT ≤ dH < 1320 nT | |
| Severe storm | K=8 | 1321 nT ≤dH < 2000 nT | |
| Extreme storm | K=9 | 2001 nT ≤ dH < 10000 nT |
Dombås
| Colour | Description | Physical Measure | Threshold |
|---|---|---|---|
| Quiet | K<4 | dH < 50 nT | |
| Disturbed | K ⁓ 4 | 50 nT ≤ dH < 106 nT | |
| Minor storm | K=5 | 106 nT ≤ dH < 180 nT | |
| Moderate storm | K=6 | 181 nT ≤ dH < 300 nT | |
| Strong storm | K=7 | 301 nT ≤ dH < 495 nT | |
| Severe storm | K=8 | 496 nT ≤ dH < 750 nT | |
| Extreme storm | K=9 | 751 nT ≤ dH < 10000 nT |
The corresponding provisional K-indices in last seven days