Ground Geomagnetic Activity (deltaH)
Stackplot of Norwegian line

Stackplot of Finnish line
Sweden (Kiruna)
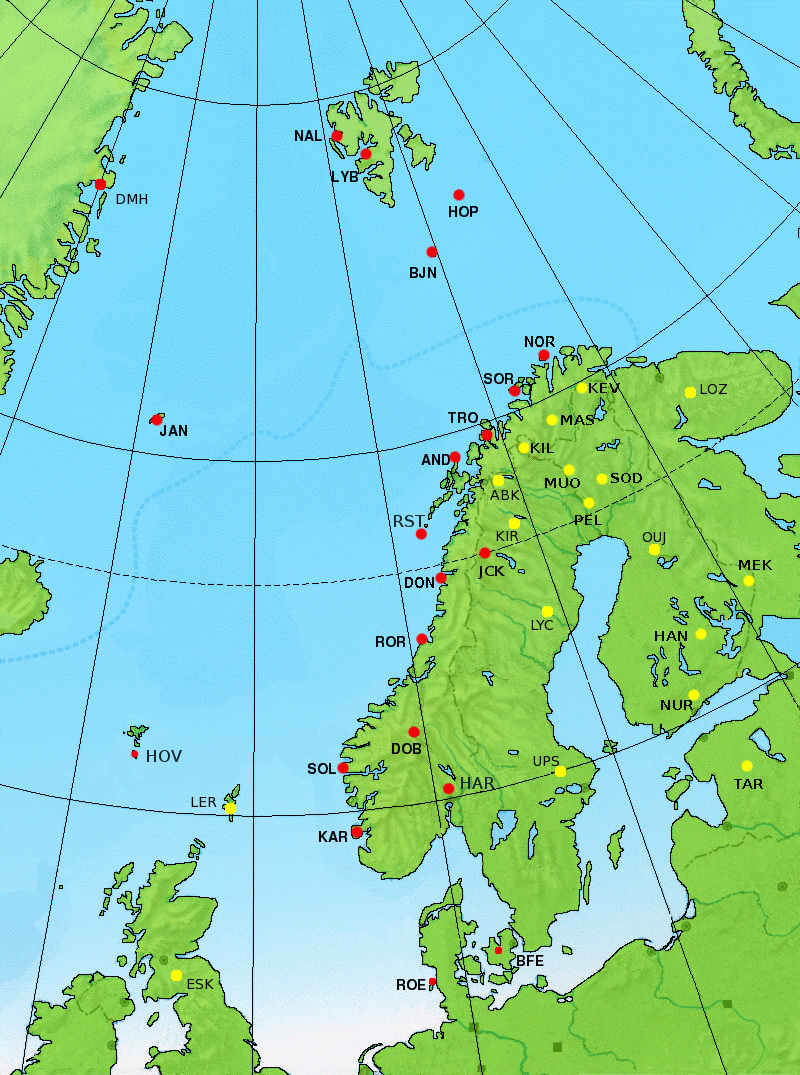
Map
Information
The time series are available within the framework of the Nordic Virtual Observatory project. This collaboration of Tromsø Geophysical Observatory (TGO), the Finnish Meteorological Institute (FMI), Sodankylä Geophysical Observatory (SGO), and the Swedish Institute of Space Physics (IRF) intends to achieve a higher degree of effectiveness in observations related to external geophysics and to operate a centralized visualization and dissemination of regional core data via the Nordic Space Weather Situation Screen.
On the derivation of the index: The local indices define geomagnetic activity in each hour as the range deviation (absolute difference between the registered maximum and minimum values) in the H component of the geomagnetic field. The definitive hourly index values are depicted near real-time (latest value), and as archive for the latest 30 days. When defining the range, we do not quantify the so called quiet daily curve (QDC) variation of the field in a separate step as typically done for mid and low-latitude indices. It has been shown that the arduous QDC treatment is important at lower latitudes but less so at auroral latitudes; (i) the hourly gradient of the regular Sq variation is very small with respect to the irregular part (“activity”) and (ii) a bulk of the nominal daily variation is actually part of the variation driven by solar wind and IMF and traditionally classified as irregular. Therefore, attempts to subtract QDC may in fact lead to a larger error, often caused by residual deviations between the used different mathematical and methodological tools and corresponding presumptions themselves.
Reference: Martini et al (2016) “Revisiting geomagnetic activity at auroral latitudes: No need for regular quiet curve removal for geomagnetic activity indices based on hourly data”, J. Geophys. Res. Space Physics, 121, [doi:10.1002/2015JA022041]