Ap 27-day Forecast
Ap 27-day forecast
Information
The Ap index quantifies the global daily average activity level of the geomagnetic field. The 27-day forecast of the Ap index is performed using the Auto-regressive Integrated Moving Average (ARIMA) method and it is based on the work of McPherron (1999) in their paper “Predicting the Ap index from past behavior and solar wind velocity” [doi:10.1016/S1464-1917(98)00006-3]. The Ap forecast is based on identifying recurring geomagnetic activity. Thus, it will not forecast transient activity. This will also affect the quality depending on the solar cycle, with best results in the declining phase, while almost random results otherwise.
We advice caution when interpreting the product. The prediction may be best understood as the longer-term smoothed level of the geomagnetic activity ‘climate’ around which the actual daily activity would fluctuate.
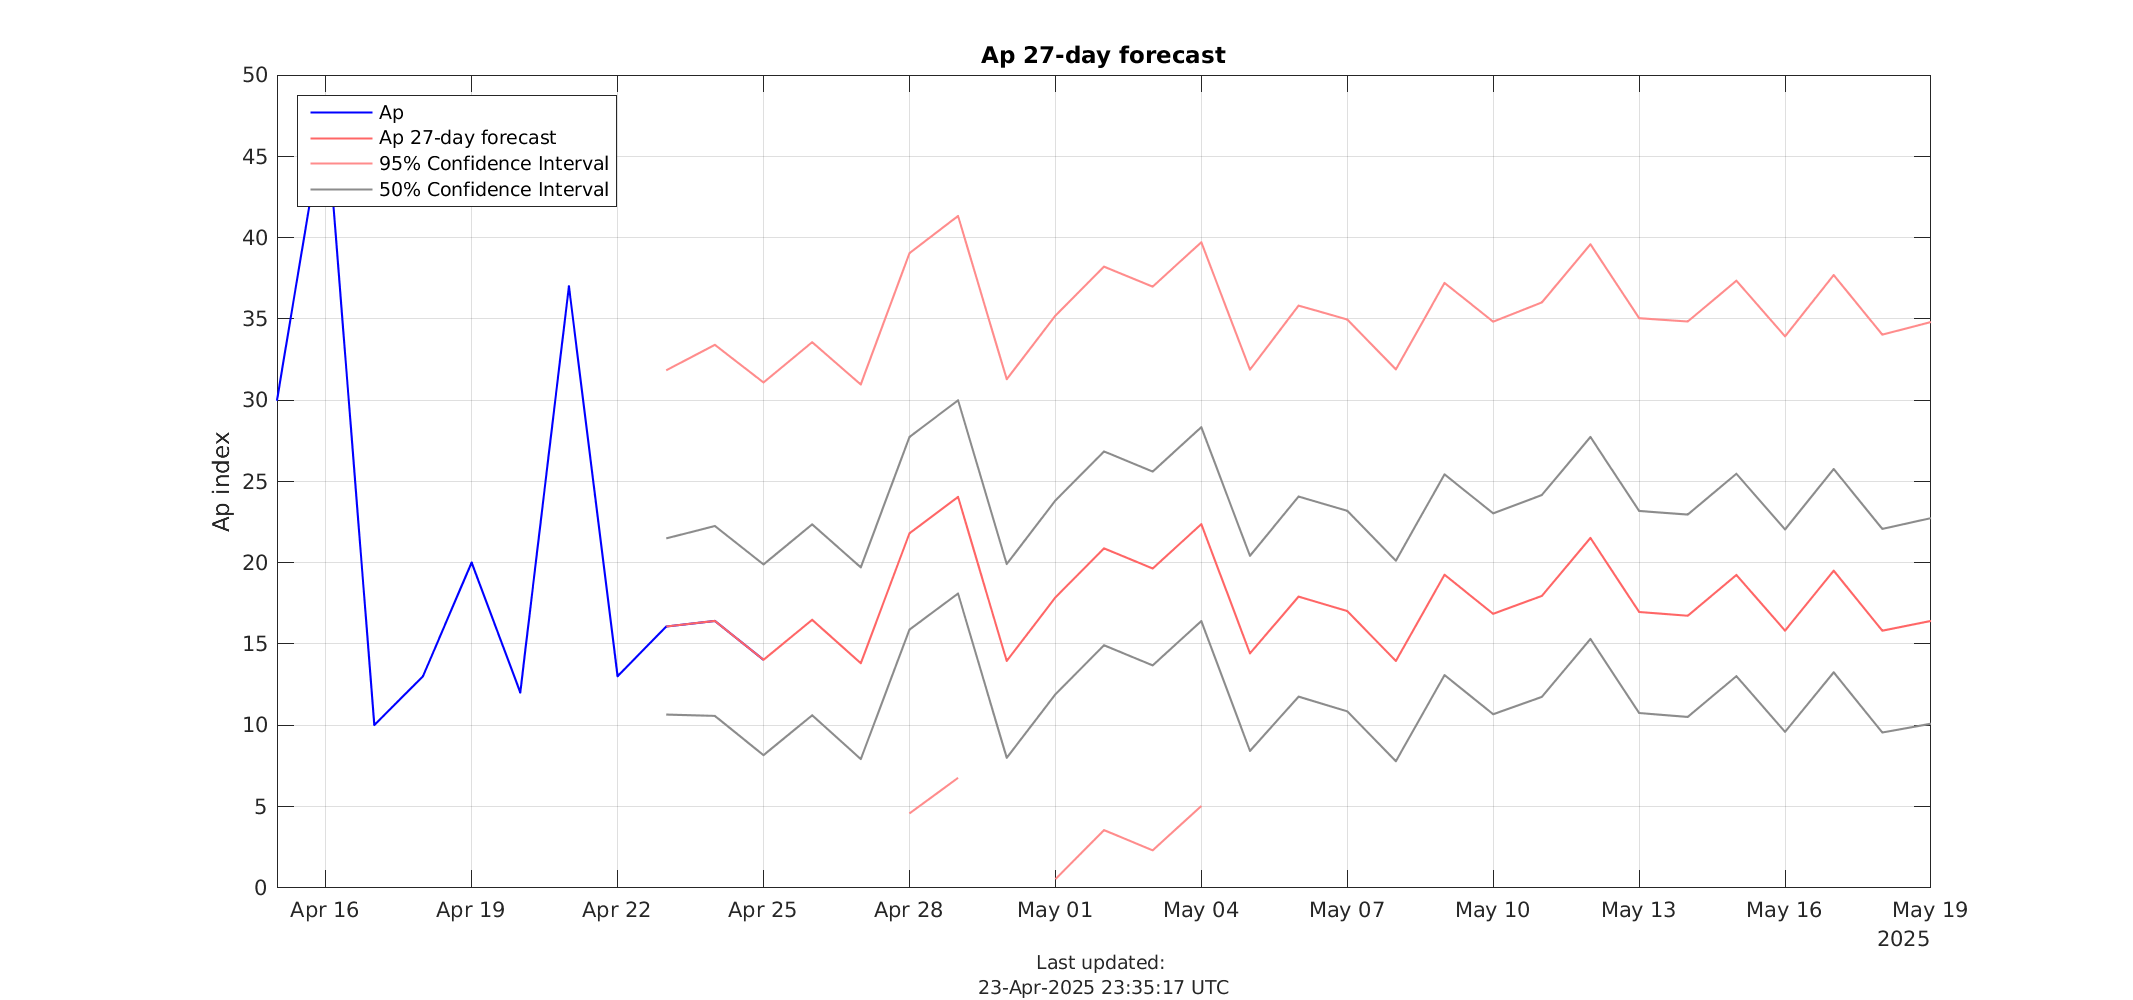
The figure shows daily values of Ap (blue line) for the last 7 days, together with the forecasted next 27-days (red line), also with daily values. The dotted gray line indicates the 50% confidence interval, while the dotted red line indicates the 95% confidence interval.
The figure is updated daily. All date and time values are given in UTC.
Ap numerical values used to produce the forecast are provided by German Research Centre for Geosciences (GFZ).
Acknowledgement
These results are very much based on projects that received funding from the ESA Space Situational Awareness Programme’s network of space weather service development activities under ESA contract number 4000113185/15/D/MRP.
All publications and presentations using data obtained from this site should acknowledge the Norwegian Centre for Space Weather at Tromsø Geophysical Observatory and the ESA Space Situational Awareness Programme.